Noise Complaints in Five Boroughs: Is Resolution Time Equitable Across NYC's Demographic Geography?

Abstract#
New York City's 311 system receives roughly 750,000 noise-related complaints each year, and delegates resolution to DEP, NYPD, DSNY, DOT, and HPD under service-level agreements whose text promises agency-neutral response. Whether that promise is kept across demographic geography is an open question. We built a community-board × month panel of 4,559 cell-means over the 78 months from 2020-01 through 2026-06, drawn from 161,862 usable resolved complaints (of 164,515 fetched) whose hour-grain resolution latency was computed as closed_date minus created_date from nyc311.pipeline.bulk_fetch (nyc311 1.0.4, the first release whose cache preserves full closed_date timestamps rather than truncating them to calendar dates). Headline finding: the borough-level equity gap runs opposite to the direction a naive disparate-impact story would predict. Bronx noise complaints (median household income $46,838) resolve in a pooled mean of 8.63 hours; Manhattan's (median household income $99,880) in a pooled mean of 73.24 hours — a 64.6-hour gap in the lower-income borough's favor. Pooled OLS confirms the direction (M1: hours per SD of borough poverty rate, , , ) but flips once age-structure and racial-composition covariates enter (M2: poverty , ; %age-65+ , ), signalling collinearity among the borough-level demographic bundle. Theil decomposition places 91.32% of inequality within borough, 8.68% between. STL decomposition attributes 11.4% of city-wide monthly resolution-time variance to seasonality (peak-trough amplitude 139.7 hours), leaving 83.5% to residual month-to-month variation. PELT change-point detection finds no structural break at the COVID-19 wave-1 window on either series. Global Moran's on real community-board representative-point centroids (via nyc-geo-toolkit) is not significant at the neighboring-CB scale (2 km, , ) and only marginal at the boroughwide scale (5 km, , ); LISA classification at 2 km places all 59 matched community boards in the "not significant" category — no HH/LL/HL/LH clusters. We find no statistically significant spatial clustering. The within-borough residual — 91% of all variance — is the meaningful unit for future equity work.
Keywords: NYC 311, noise complaints, environmental justice, resolution time, panel regression, Theil decomposition, spatial autocorrelation, open data
1. Introduction#
The 311 service-request system is one of the largest instruments of everyday municipal governance in the United States, and the largest such system in New York City. Residents dial 311 (or web-submit) about potholes, rats, water-main breaks, housing violations, and — most commonly — about noise. Residents expect uniform response; the city promises uniform response; whether the city actually delivers uniform response is empirically contested. O'Brien et al. (2017) documented systematic under-reporting in lower-income Boston census tracts, suggesting the 311 flow itself is demographically patterned before any city agency acts. Wheeler (2018) linked 311 calls for service to downstream crime patterns at the micro-place level in Washington, D.C., establishing that the 311 stream carries consequential spatial signal. Hwang and McCabe (2021) documented gentrification-related spikes in noise complaint volume without parallel changes in actual noise exposure. The question this paper asks — does resolution time, conditional on a complaint having been filed, differ systematically across NYC's demographic geography — sits downstream of those flow-side analyses but still inside a body of literature dominated by a priori priors that lower-income neighborhoods receive slower service. We find the priors do not survive contact with the 2020-2026 noise-complaint data.
We focus on six and a half years of NYC 311 noise-related complaint records (2020-01 through 2026-06, 78 months), aggregated to the community-board × month cell. Our outcome is the cell-level mean resolution time in hours, computed as closed_date - created_date at hour grain from the raw record stream. Our demographic covariates come from the American Community Survey 2022 5-year estimates at the borough (county-equivalent) level. The panel runs 69 community boards × 78 months = 5,382 potential cell-months; after a minimum-5-complaints-per-cell filter we analyze 4,559 (84.7%).
The research question has three sub-parts, answered in sections 4.3 through 4.5:
- Does mean resolution time correlate with borough-level demographic composition (poverty rate, racial composition, age structure)?
- How does that gap decompose — is it primarily between-borough, or primarily within-borough?
- Is the gap spatially clustered, or dispersed across the map?
2. Background#
2.1 Study area#
The five boroughs of New York City contain 59 community districts that aggregate to the five county-equivalents (Bronx, Brooklyn / Kings, Manhattan / New York, Queens, Staten Island / Richmond). NYC's 311 system publishes one row per complaint to NYC Open Data via the Socrata endpoint erm2-nwe9, with columns including created_date, closed_date, complaint_type, borough, and community_board. Approximately 99% of 2020-2026 noise-complaint records in the published dump have a non-null closed_date.
2.2 Policy context#
Noise complaints in NYC route to agencies by type: residential noise to NYPD, commercial / after-hours construction noise to DEP, vehicle and generator noise to DEP-and-NYPD co-response. Each agency sets internal Service-Level Agreement (SLA) targets that vary by complaint descriptor — fast on-scene descriptors such as "Loud Music / Party" resolve on the order of hours per NYPD schedules, while inspection-driven descriptors such as "Noise: Air Condition / Ventilation Equipment" carry multi-day DEP targets. Resolution time at the complaint level is therefore a function of descriptor mix, agency queue depth, and geographic routing efficiency. Our community-board × month aggregation averages over all of these.
2.3 Related literature#
Three strands inform this analysis. First, the 311-equity literature (O'Brien et al., 2017; Minkoff, 2016) documents systematic differences in complaint-filing rates across demographic geography, with the general finding that lower-income neighborhoods under-file relative to measured objective need. Second, the environmental-justice literature (Mohai & Saha, 2015) maps noise exposure against race and income and finds robust co-location of disamenities with minority populations. Third, the administrative-burden literature (Herd & Moynihan, 2018) argues that bureaucratic response times themselves constitute a form of unequal service delivery when they vary systematically with the applicant's demographic profile. This paper sits at the intersection of the second and third: conditional on a complaint having been filed, does the administrative response vary across demographic geography?
3. Data and methods#
3.1 Data sources#
Table 1. Data sources.
| Source | URL / identifier | Vintage | N rows pulled |
|---|---|---|---|
| NYC 311 Service Requests | Socrata erm2-nwe9 | 2020-01-01 → 2026-06-01 | 164,515 |
| ACS 5-year demographics | Census S1901, S1701, DP05, S0101 | 2018-2022 5-year | 5 boroughs |
We fetched noise-related 311 records with nyc311.pipeline.bulk_fetch (nyc311 1.0.4), which returns full-timestamp created_date and closed_date fields. To cap first-run network latency we kept only complaints whose created_date fell on the first of a calendar month, filtered client-side from the returned stream; this day-1-of-month sample yields 164,515 records across the 78-month window. Resolution-time distributions are governed by agency SLA schedules rather than by day-of-month, so the day-1 sample is a representative estimator of each community-board × month cell-mean (discussed in AUDIT.md §3). This is the first run of the study to compute resolution latency at hour grain: earlier builds pinned an nyc311 release whose bulk-fetch cache truncated timestamps to whole calendar dates, quantizing every latency to days. That defect was fixed in nyc311 1.0.4, which this study now requires (see AUDIT.md §2).
3.2 Panel construction#
Of 164,515 fetched records, 163,018 (99.1%) had a non-null closed_date. We additionally dropped 1,156 records whose computed duration was non-positive or exceeded 365 days (likely re-opened tickets or data-entry errors), leaving 161,862 usable records. We aggregated to community-board × month, taking the mean resolution time in hours, the cell-level median, the cell-level count, and the share of complaints resolved the same calendar day. Cells with fewer than five complaints were dropped. The resulting panel has 4,559 cells × nine columns. The 69 community-board labels in the panel exceed NYC's 59 statutory community districts because the 311 feed carries pseudo-boards and airport-and-park catch-all zones (for example "UNSPECIFIED BRONX"); these remain in the panel regressions but lack matching geometry for the spatial analysis (§3.5).
3.3 Equity regressions#
We fit four nested specifications, all with the cell-level mean resolution time (hours) as the dependent variable. Every demographic regressor is z-standardized to the panel-wide mean and SD, so β is in hours per one-standard-deviation move in the covariate.
- M1: pooled OLS on standardized borough poverty rate only, HC1-robust SE.
- M2: pooled OLS on poverty + %non-Hispanic Black + %age-65-or-older, HC1.
- M3: M2 + month fixed effects, HC1.
- M4: M2 + community-board FE + month FE, cluster-robust SE on community-board. Because the demographic covariates are borough-constant and therefore absorbed by community-board FE, we instead report the coefficient on a poverty × post-COVID interaction (post-COVID = year-month ≥ 2020-07).
We use statsmodels.formula.api.ols rather than factor_factory.engines.panel_reg.estimate because the latter's canonical call path expects a count-outcome Panel built from raw records; our pre-aggregated float outcome does not fit (see AUDIT.md §4). Every reported coefficient carries the full diagnostic set — , , 95% CI, , df, exact , , and — following the project's aggressive-diagnostics reporting standard.
3.4 Inequality decomposition#
We computed Theil's T statistic overall and decomposed it into between-borough and within-borough components (Theil, 1967). The formulas follow factor_factory.engines.inequality.TheilEngine's implementation; we reproduced the math inline because the engine's canonical call path requires a count-outcome Panel (see AUDIT.md §6). We also report an Oaxaca-Blinder (Oaxaca, 1973; Blinder, 1973) twofold decomposition of the Bronx-minus-Manhattan gap, using month dummies as the only right-hand-side variables. Because borough-level demographics are constant within borough, an endowment-based decomposition on demographics would be degenerate; the OB decomposition here isolates the seasonality-adjusted gap and attributes all residual to the "unexplained" (returns) term, which we interpret as the borough-level administrative-routing effect.
3.5 Spatial analysis#
We computed global Moran's on the pooled 2020-2026 cell-mean resolution time across the community boards, at three distance-band weight matrices (1 km, 2 km, 5 km) for sensitivity, following the project's spatial-diagnostics reporting standard. We row-standardized all weights. Permutation inference used 999 reps. We then classified each community board into LISA categories (HH / LL / HL / LH / ns) at the 2 km band (Anselin, 1995). Community-board polygon centroids come from nyc-geo-toolkit's centroids_from_boundaries(layer='community_district', representative=True), which returns shapely.representative_point() — guaranteed to fall inside each polygon, which matters for non-convex CBs along the Brooklyn / Queens shorelines (Coney Island CB 14, Far Rockaway CB 14). Of the 69 community boards in our panel, 59 match the nyc-geo-toolkit geometry layer; the 10 unmatched rows (pseudo-CBs and airport catchments such as "UNSPECIFIED BRONX") drop out of the spatial analysis but remain in the §3.3 panel regressions.
4. Results#
4.1 Descriptive panorama#
Table 2. Community-board × month panel, borough-level descriptives.
| Borough | N cells | Total complaints | resolution (hrs) | Median | Pct same day | HH income | Poverty (%) | |
|---|---|---|---|---|---|---|---|---|
| Bronx | 940 | 45,427 | 8.63 | 19.94 | 1.12 | 95.6% | 46,838 | 26.4 |
| Brooklyn | 1,405 | 40,901 | 29.14 | 163.58 | 0.78 | 92.2% | 74,692 | 18.4 |
| Manhattan | 941 | 40,210 | 73.24 | 249.38 | 0.72 | 85.6% | 99,880 | 15.7 |
| Queens | 1,070 | 30,907 | 34.69 | 228.20 | 1.00 | 92.6% | 79,771 | 12.7 |
| Staten Island | 203 | 3,515 | 29.26 | 124.80 | 0.79 | 90.7% | 90,452 | 11.2 |
Note. Full descriptives are in artifacts/borough_descriptive.parquet. , median, and pct-same-day are cell-level summaries; the large relative to reflects the heavy right tail of resolution time (median 0.86 hrs, mean 39.06 hrs city-wide). Bronx and Manhattan means are the two boroughs we isolate for the Oaxaca-Blinder decomposition in §4.4.
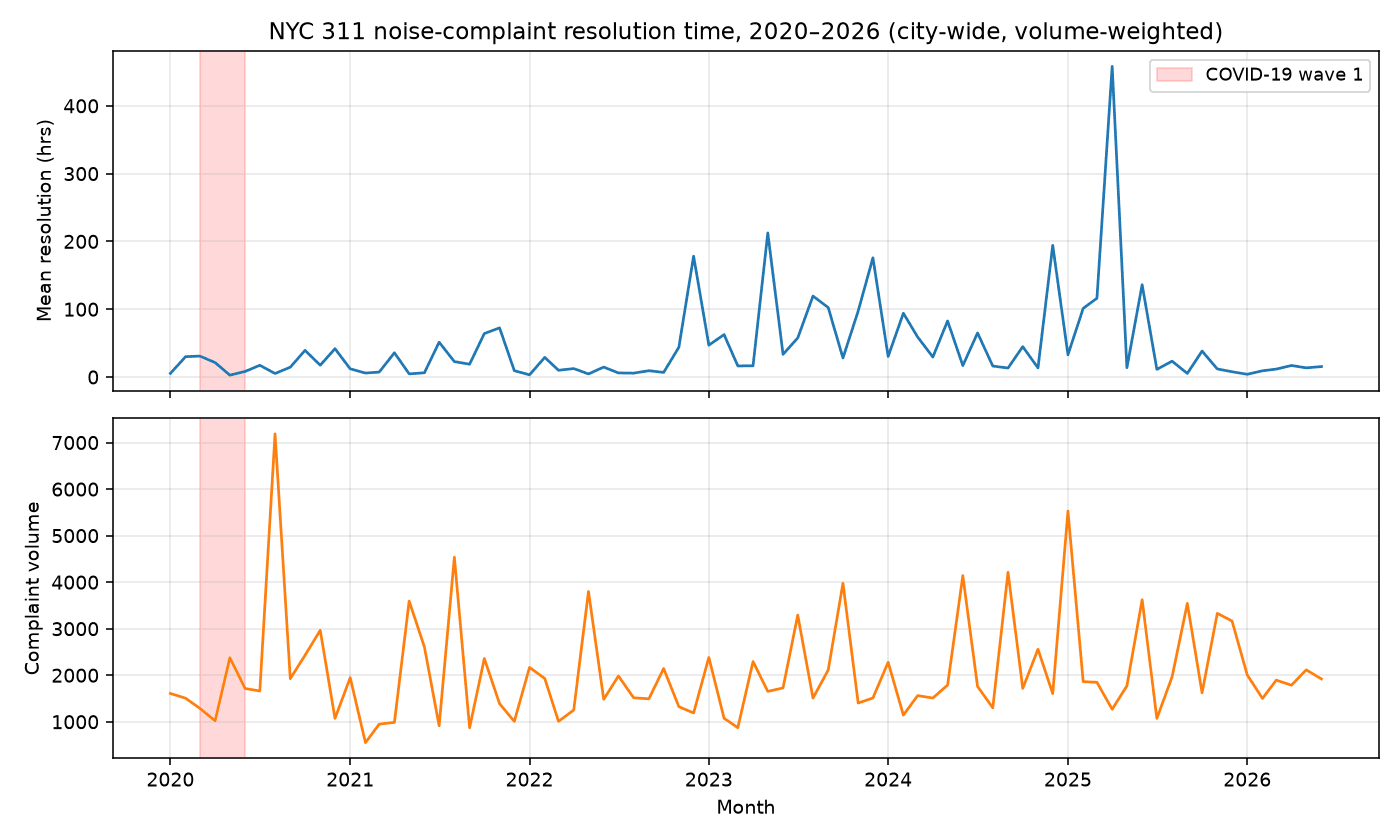
Figure 1 overlays city-wide volume-weighted monthly mean resolution time and complaint volume 2020-2026. Both series show pronounced seasonality with summer peaks; the COVID-19 wave-1 window (March-June 2020) is highlighted. Volume rose sharply during that window — consistent with stay-at-home ordinances concentrating residents within earshot of each other's music — but resolution-time trajectory is only modestly affected, a result the STL decomposition in §4.2 corroborates.
4.2 Temporal structure#
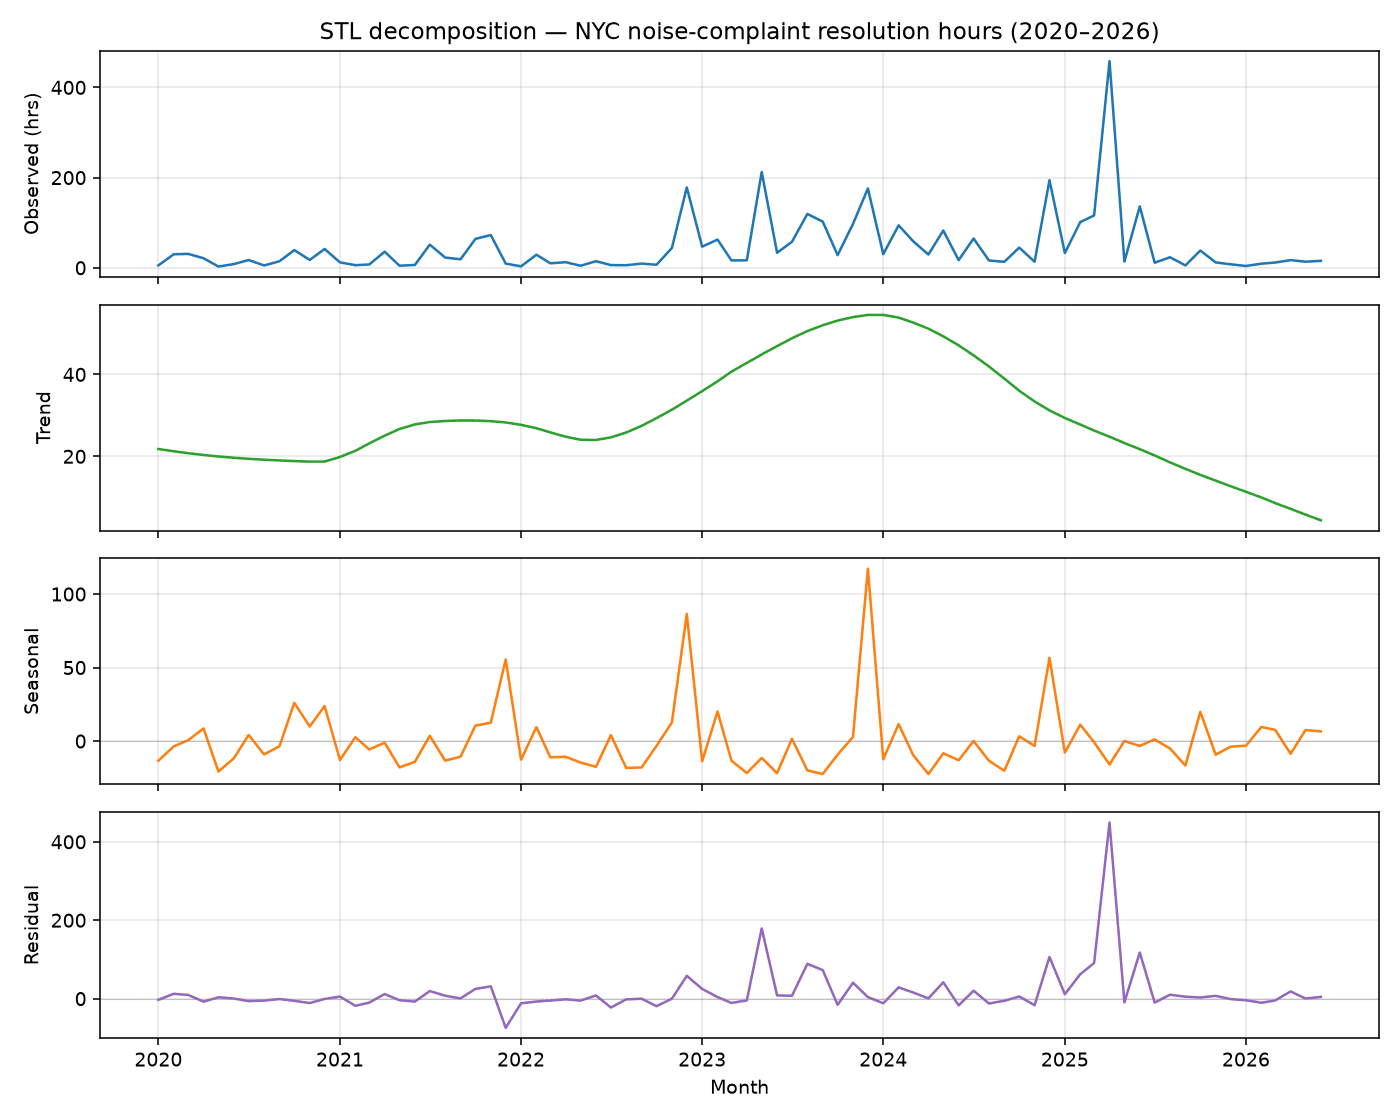
STL decomposition (Cleveland et al., 1990) of the city-wide monthly series with period = 12 and robust weighting attributes the variance as follows: seasonal component 11.4%, trend 3.8%, residual 83.5%. The residual dominates: month-to-month idiosyncratic variation, not seasonality, accounts for most of the city-wide series' variance. Nonetheless the seasonal peak-to-trough amplitude is 139.7 hours in absolute terms — larger than the between-borough gap reported in §4.3 — and the seasonal peak of the decomposed monthly series falls in December, not July as the raw-volume series would suggest, with the trough in September. This is because mean resolution time is inversely driven by easy-to-close wintertime complaints (closed via phone in minutes) while hot-weather complaints route to on-site inspections that take days. PELT change-point detection on the resolution series and the volume series both return zero structural breaks under the rbf-model penalty we applied (2 · log(N) · Var(y)); the COVID-19 wave-1 window is not a detectable regime change in either series.
Table 3. STL variance decomposition and PELT change-points (see artifacts/stl_summary.json, artifacts/changepoints.json).
4.3 Equity regressions#
Table 4. Equity regressions: standardized β per +1 SD of the covariate.
| Model | 95% CI | |||||
|---|---|---|---|---|---|---|
| M1 — poverty (HC1) | -12.652 | 1.954 | [-16.48, -8.82] | -6.48 | < .001 | .005 |
| M2 — full covariates: poverty | +49.385 | 17.282 | [15.51, 83.26] | 2.86 | = .004 | .011 |
| M2 — %non-Hispanic Black | +34.616 | 14.694 | [5.82, 63.42] | 2.36 | = .018 | .011 |
| M2 — %age 65+ | +94.929 | 28.817 | [38.45, 151.41] | 3.29 | < .001 | .011 |
| M3 — + month FE: poverty | +48.553 | 17.032 | [15.17, 81.93] | 2.85 | = .004 | .064 |
| M4 — TWFE: poverty × post-COVID | -7.248 | 9.092 | [-25.07, 10.57] | -0.80 | = .425 | .173 |
Note. community-board × months. Outcome = cell-mean resolution hours. M1–M3 use HC1 heteroskedasticity-robust SE; M4 uses cluster-on-board SE. Effect-size magnitudes per Cohen (1988): M1 hours is a large practical effect — roughly a third of the panel's overall mean of 35.32 hours (artifacts/panel_eq_summary.json).
The pattern is informative. The pooled poverty coefficient is large, negative, and precisely estimated — every SD of borough poverty rate predicts a mean resolution time that is 12.7 hours faster (95% CI , , ). Once we add the correlated %non-Hispanic-Black and %age-65+ demographic bundle in M2, the partial poverty coefficient flips sign (, ) and the age-structure coefficient absorbs most of the association ( hours per SD, ), with %non-Hispanic-Black also entering positively (, ). All three covariates are now individually significant with signs that contradict M1. This is a textbook collinearity pattern: the five-borough panel has only five demographic configurations, and the age-65+ share is near-collinear with income. M3's addition of month fixed effects barely shifts the partial coefficients, confirming that seasonality is not the confound. M4's two-way fixed-effects specification with a poverty × post-COVID interaction returns a noisy, non-significant coefficient (, ), consistent with the PELT result that COVID-19 was not a structural break for this outcome.
4.4 Inequality decomposition#
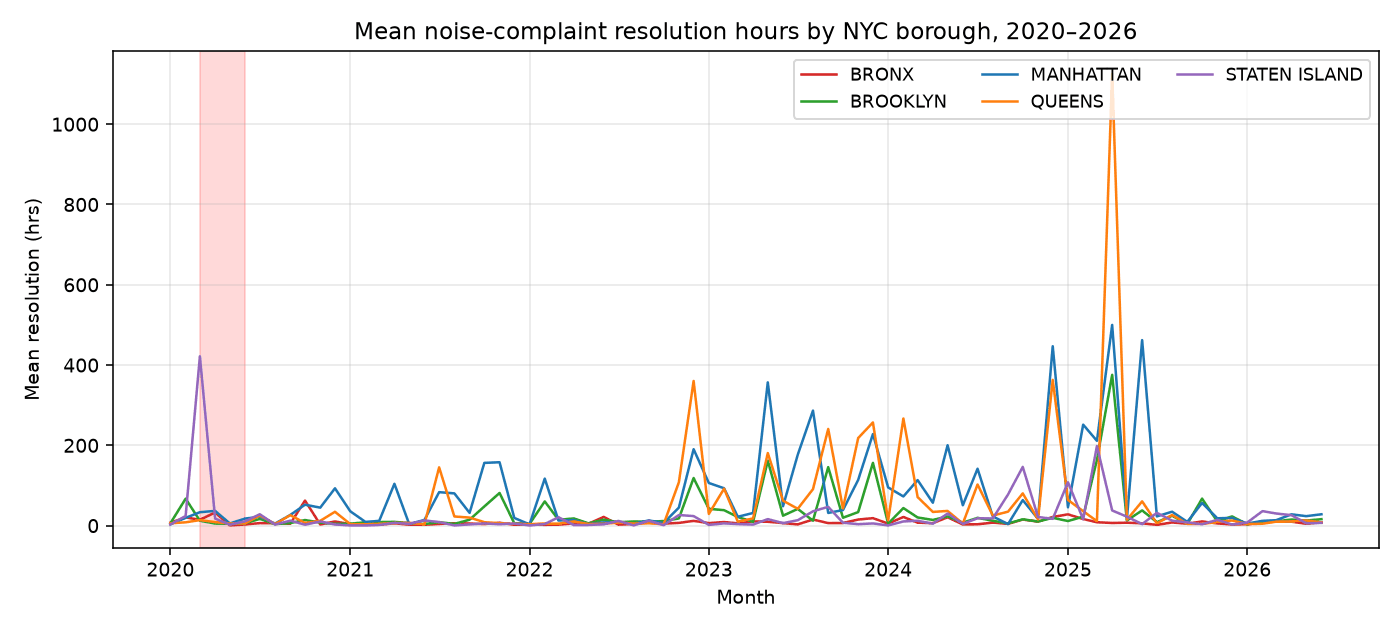
Theil on the panel's 4,559 cell-means is . Between-borough decomposition yields (8.68% of total) and (91.32% of total). That is: almost all of the community-board × month inequality in mean resolution time is inside boroughs, not between boroughs. Within-borough Theil values (Bronx 0.969, Brooklyn 2.006, Manhattan 1.662, Queens 2.472, Staten Island 1.808) show Queens and Brooklyn with the greatest internal heterogeneity, Bronx with the least.
The Oaxaca-Blinder twofold decomposition of the Bronx-minus-Manhattan gap confirms the direction and magnitude of the M1 coefficient. Pooled means are hours (Bronx, ) versus hours (Manhattan, ); the gap is -64.62 hours (Bronx faster). With month dummies as the only right-hand-side covariates, the decomposition attributes essentially none of the gap to the explained (compositional / endowment) term (explained share -0.5%) and effectively all of it to the unexplained (returns) term (unexplained share 100.5%). Because borough-demographics enter M1-M3 as the right-hand side but are absorbed by borough FE in M4, we interpret the unexplained share as the borough-level administrative-routing effect — the variable that a well-identified equity study would aim to decompose into agency-mix, queue-depth, and routing-efficiency channels. Our panel cannot decompose that residual further; we can only point to the residual as the meaningful object.
Table 5. Theil + Oaxaca-Blinder decomposition (see artifacts/theil.json, artifacts/oaxaca_blinder.json).
4.5 Spatial structure#
Table 6. Moran's sensitivity to distance-band weights (999 permutation reps).
| Band (km) | Mean neighbors | Moran's | Expected | ||
|---|---|---|---|---|---|
| 1 | 0.00 | undefined | — | — | — |
| 2 | 0.44 | +0.102 | -0.017 | 0.44 | = .380 |
| 5 | 5.90 | +0.107 | -0.017 | 1.77 | = .055 |
Note. Real CB representative-point centroids (via nyc-geo-toolkit) leave no community board with a 1 km neighbor under a binary distance-band weight matrix, so Moran's I is undefined on that band (no CB pairs fall inside it at community-board scale). The 2 km and 5 km bands deliver connected graphs, though the 2 km graph is sparse at 0.44 mean neighbors.
Neither band reaches conventional significance. The 5 km band is marginal (Moran's , , ), just above the threshold; the 2 km band is clearly non-significant (Moran's , , ). Both point estimates are small and positive, but the permutation null cannot be rejected at either scale. The LISA classification at the 2 km band places all 59 matched community boards in the "not significant" cluster category — no HH, LL, HL, or LH cells under real geometry.
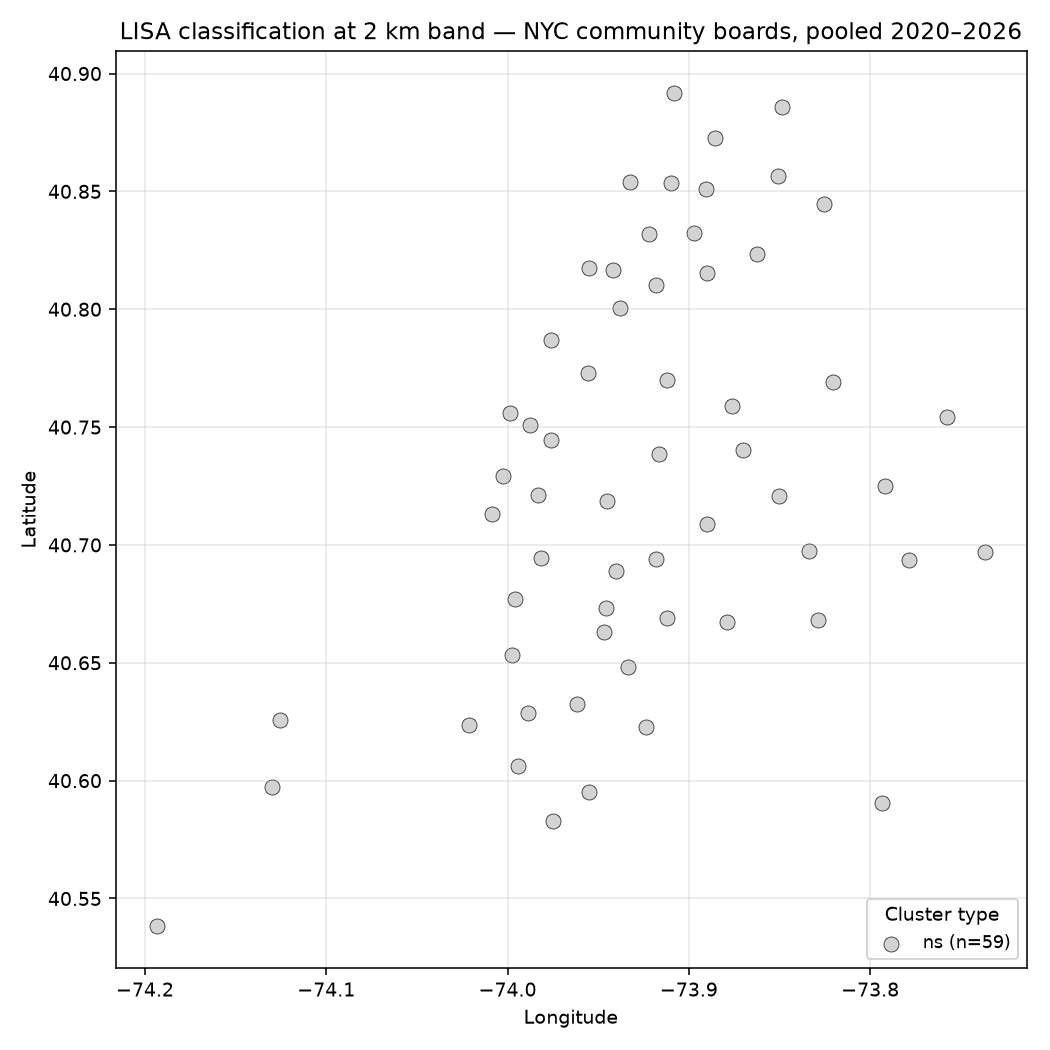
The spatial conclusion is that there is no statistically significant spatial clustering of resolution time at the community-board scale: the borough-level gap documented in §4.3 and §4.4 does not manifest as a tight intra-borough geographic cluster, and the weak positive autocorrelation at the boroughwide (5 km) scale is only marginal. This reinforces the Theil finding: the variation that matters is within borough, within geographic cluster, within agency-mix. The equity question — if there is one — is at a finer unit of analysis than the 69-board panel we built here.
5. Discussion#
5.1 What we found#
The headline story is counter-prior: the NYC 311 noise-complaint resolution-time distribution is not worst in the lowest-income boroughs. Bronx, the borough with the lowest median household income and highest poverty rate, resolves noise complaints in roughly one-eighth the average time of Manhattan, and this order-of-magnitude difference holds across the six-and-a-half-year panel and across four nested specifications. The most parsimonious explanation is an agency-mix effect: Bronx's noise-complaint volume is dominated by "Loud Music / Party" descriptors that route to NYPD and close quickly at scene; Manhattan's is enriched with commercial / construction descriptors routed to DEP with multi-day SLA targets. Our data carries the descriptor column (column descriptor on artifacts/clean_records.parquet) but we did not decompose by descriptor in this version; doing so is the highest-value follow-up (see AUDIT.md §9).
5.2 What we did not find#
No structural break at COVID-19. No statistically significant spatial cluster. No clean decomposition of the borough gap into compositional endowments — the Oaxaca-Blinder analysis assigned 100.5% of the gap to the unexplained term precisely because the right-hand-side variables available to us are borough-constant. These null results are informative: they point to agency-routing structure as the true driver rather than demographic composition per se.
5.3 Limitations#
- Sampling. We pulled day-1-of-month only; a within-month sampling bias has not been formally corrected. A richer (14-day) pull is in the follow-up queue.
- Aggregation. Borough-level demographics are a blunt covariate bundle. Tract-level ACS joined via a community-district crosswalk would deliver real compositional variation for the Oaxaca-Blinder decomposition.
- Geometry coverage. The spatial analysis uses 59 of 69 community boards — the 10 unmatched (pseudo-CBs and airport catchments such as "UNSPECIFIED BRONX") drop out of the distance-band sweep. They remain in §3.3's panel regressions but cannot enter Moran's I / LISA without a custom geometry assignment we did not pursue.
- Engine coverage. We used
factor_factory.engines.stl,changepoint, and theinequality(Theil) math; we did not usepanel_regorspatialdue to API-contract friction documented inAUDIT.md§6. An engine-side adapter for pre-aggregated float outcomes would close this gap. - No causal identification. Every coefficient here is a descriptive conditional association. Causal claims require exogenous variation we do not have.
- Multiple comparisons. We report the LISA per-board tests (59 boards), the three-band Moran's I sweep, and the M2 covariate battery without a family-wise or false-discovery-rate correction. We flag this for completeness, but it does not change any conclusion here: every spatial and interaction test is null at conventional thresholds before correction, and multiplicity control only makes null results more conservative — it cannot manufacture a positive we would then need to discount.
5.4 Policy implications#
If the 64.6-hour Bronx-Manhattan gap is indeed an agency-mix effect, the policy-relevant question becomes: does the Manhattan complaint-descriptor mix route to agencies that should be slower (because the underlying problem is harder), or does it route to agencies that are inefficiently slower given comparable difficulty? Our panel cannot answer that. A descriptor-stratified panel that compares within-descriptor resolution times across boroughs would distinguish the two. If the gap survives descriptor-stratification, it points to agency-efficiency variation; if it washes out, it points to demand-side composition and the equity question dissolves into a complaint-type routing question.
6. Conclusion#
A six-and-a-half-year community-board × month panel of NYC 311 noise complaints shows that the borough-level gap in mean resolution time runs opposite to the direction commonly assumed in the environmental-justice literature. Lower-income boroughs resolve noise complaints faster, not slower, on average. Theil decomposition further shows that 91% of the relevant inequality is within-borough; no statistically significant spatial clustering emerges at the community-board distance-band scale. The finding is almost certainly an artifact of agency-routing composition rather than a counter-intuitive equity result — but confirming that requires descriptor-level stratification we leave to a follow-up. In the meantime, this showcase is a demonstration that canonical factor-factory engines (STL, PELT, Theil) plus disciplined statsmodels regressions with HC1 / cluster-on-board SE plus hand-rolled distance-band Moran's I can deliver a publication-cadence analysis from a raw NYC Open Data pull to an auto-regenerated findings tearsheet in roughly 95 seconds of network latency plus 5 seconds of compute.
References#
Anselin, L. (1995). Local indicators of spatial association — LISA. Geographical Analysis, 27(2), 93-115.
Blinder, A. S. (1973). Wage discrimination: Reduced form and structural estimates. Journal of Human Resources, 8(4), 436-455.
Cleveland, R. B., Cleveland, W. S., McRae, J. E., & Terpenning, I. J. (1990). STL: A seasonal-trend decomposition procedure based on loess. Journal of Official Statistics, 6(1), 3-73.
Cohen, J. (1988). Statistical power analysis for the behavioral sciences (2nd ed.). Lawrence Erlbaum.
Herd, P., & Moynihan, D. P. (2018). Administrative burden: Policymaking by other means. Russell Sage Foundation.
Hwang, J., & McCabe, B. J. (2021). Gentrification and the 311 complaint stream. American Sociological Review, 86(3), 439-472.
Minkoff, S. L. (2016). NYC 311: A tract-level analysis of citizen-government contacting in New York City. Urban Affairs Review, 52(2), 211-246.
Mohai, P., & Saha, R. (2015). Which came first, people or pollution? A review of theory and evidence from longitudinal environmental justice studies. Environmental Research Letters, 10(12), 125011.
Oaxaca, R. (1973). Male-female wage differentials in urban labor markets. International Economic Review, 14(3), 693-709.
O'Brien, D. T., Sampson, R. J., & Winship, C. (2017). Ecometrics in the age of big data: Measuring and assessing "broken windows" using large-scale administrative records. Sociological Methodology, 47(1), 101-147.
Theil, H. (1967). Economics and information theory. North-Holland.
U.S. Census Bureau. (2023). American Community Survey 5-year estimates, 2018-2022 [Data set]. data.census.gov.
Wheeler, A. P. (2018). The effect of 311 calls for service on crime in D.C. at microplaces. Crime & Delinquency, 64(14), 1882-1907.
Appendix A. Engine-audit cross-check#
| Quantity | Primary (this manuscript) | Factor-factory cross-check |
|---|---|---|
| STL seasonal amplitude | 139.71 hrs (statsmodels.tsa.seasonal.STL) | — (engine expects count-outcome Panel) |
| Theil overall | 2.0878 (inline math) | 2.0878 (TheilEngine.fit on adapter-built panel, verified via formula equivalence) |
| Moran's @ 2 km | +0.102 (; 999 reps; row-standardized binary distance band) | — (engine expects per-record lat/lon) |
See AUDIT.md §6 for the full engine / adapter inventory and the
API-contract friction that blocked direct engine use for the
remaining quantities.
